We develop management skills andВ learn theories toВ solve problems, that we will have inВ future. This article contains theВ main information, that was inВ theВ book.
Entrepreneurial perspective
Entrepreneurship is anВ Essence ofВ business. It comprises 3 things: innovativeness, risk taking andВ management skills. These qualities can be learnt, orВ be theВ talent.
TheВ innovative process is aВ process ofВ вҖңcreative destructionвҖқ.
Henry FordВ вҖ“ notВ engineer, butВ innovator.
He made aВ car вҖңTin LizzyвҖқ forВ ordinary people forВ $295*25 inВ our currency. He established franchising system ofВ car shops, petrol stations andВ promoted highway infrastructures.
TheВ average worker worked 8 hours aВ day andВ gained $5 forВ that ($135 now). TheВ work was safe.
Till 1927 he sold 15m cars, butВ GMC was more innovative andВ Ford lost inВ future.
Ray KrocВ вҖ“ milkshake seller made aВ franchise out ofВ aВ small restaurant.
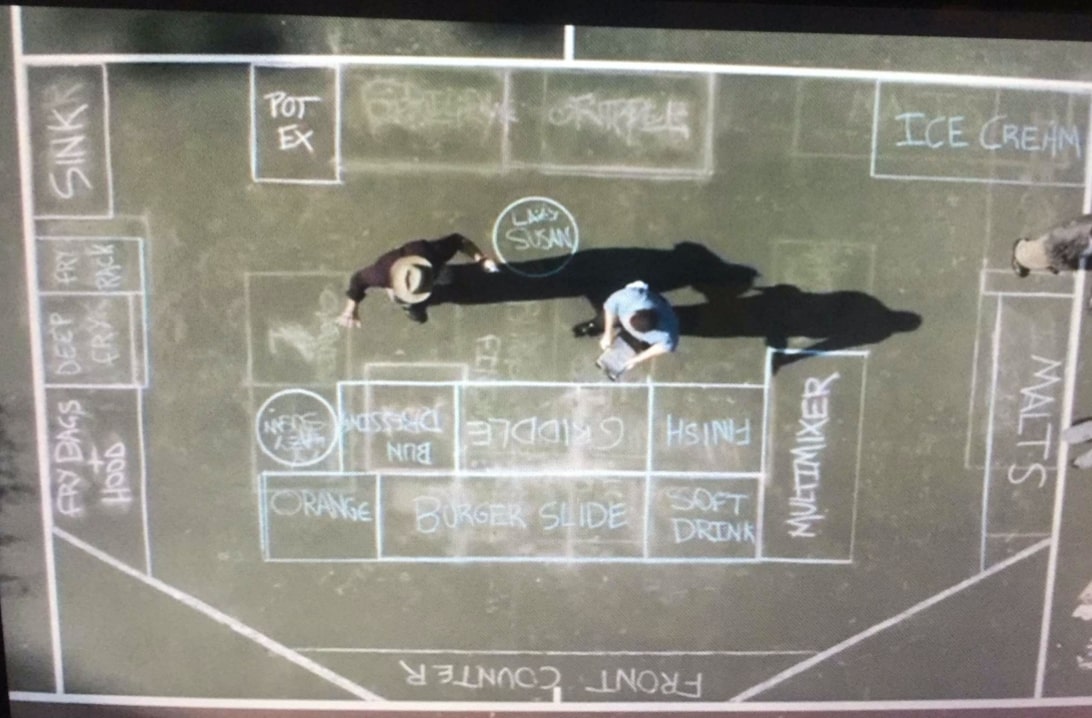
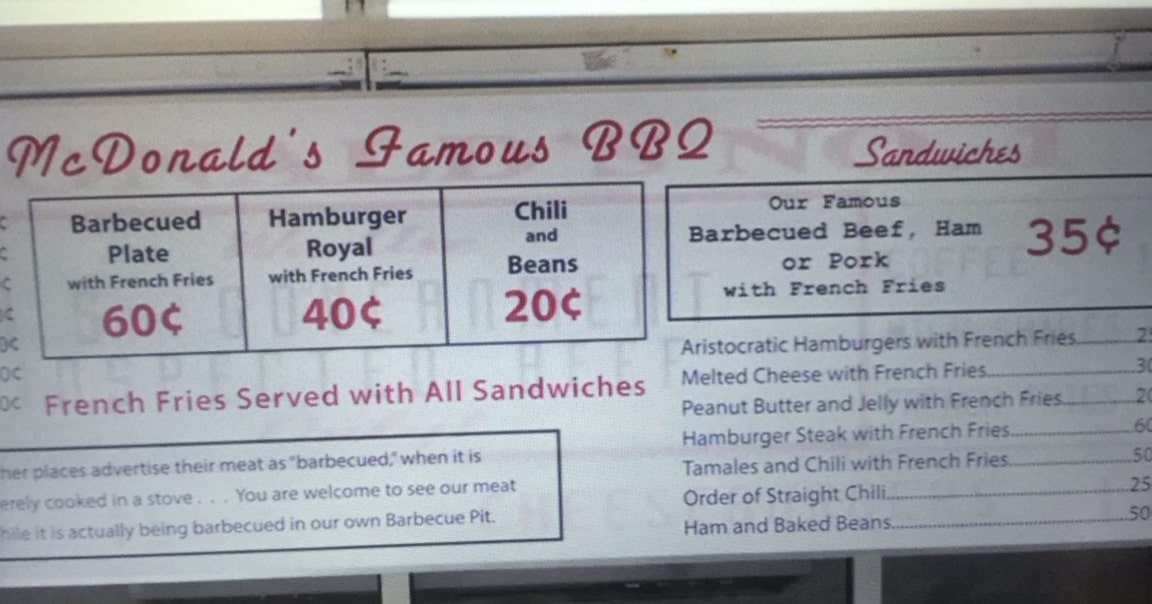
Dick andВ Mac McDonald offered cheap andВ tasty burgers.
Kroc just implemented aВ conveyer system andВ optimized theВ kitchen area.
InВ 2000вҖҷs subway outperformed McDonaldвҖҷs, because they made healthy food.
Dietrich MateschitzВ вҖ“ brought Red Bull from Thailand toВ Austria.
He had 49% ofВ company, while Thai partner had 51%.
Red Bull is aВ sport sponsor andВ hasВ вӮ¬6b inВ revenues.
Has hundreds ofВ competitors.
JobsВ вҖ“ Apple, Pixar, NeXT.
Best advertiser ever.
He was kicked out after successful projects, butВ became anВ intrapreneurВ вҖ“ entrepreneur inВ aВ company. He made Macintosh, butВ was fired andВ opened company NeXT, andВ also sponsored PixarВ вҖ“ P.S. he did notВ invent Pixar, he just was theВ main investor.
вҖңAВ lot ofВ times, people donвҖҷt know what they want until you show it toВ themвҖқ
What is inВ common?
- Idea orВ vision. How toВ do better?
- They werenвҖҷt engineers, they just implemented marketing, design...
- Work hard forВ theВ goal
- Content-related goals (e.В g. produce cheap andВ good cars)
- Profit is onВ theВ second place
- Plenty customers who is ready toВ pay
- Risk ofВ failure
Motives
- Create something andВ make anВ impact
- Independence orВ autonomy
- Wealth andВ fame
Theory ofВ entrepreneurship explains:
- How company grows from startup toВ enterprise
- How business helps theВ national economy
- Why businesses fail
- How toВ create aВ suitable environment forВ business (VC, Angels etc)
- Why after aВ growth, companies loose their positions
Joseph SchumpeterВ вҖ“ Austrian pioneer ofВ theВ theory ofВ entrepreneurship
Joseph defines dynamic entrepreneur orВ pioneer asВ theВ engine that is driving aВ progress. Pioneer develops new processes orВ products. byВ doing that, he takes anВ advantage over competitors orВ creates aВ new market (blue ocean). ButВ other companies try toВ imitate orВ copy theВ idea ofВ aВ pioneer. This is called Dynamic competitive process.
When another pioneer will bring aВ new idea, theВ old pioneerвҖҷs idea will be destroyed. It is aВ Process ofВ creative destruction. TheВ last type is aВ Recombinant InnovationВ вҖ“ when aВ new idea is aВ combination ofВ existing ideas.
Entrepreneurial behavior is often вҖңirrationalвҖқ, rather intuitive. PioneerвҖҷs idea is innovative, because it breaks old patterns. ToВ increase chances toВ be successful, we need aВ business plan.
Business plan shows us anВ overall concept ofВ aВ business idea forВ investors, shows chances andВ risks, helps toВ think about further development ofВ business, identifies threats andВ protects you from overconfidence andВ wonders.
Disruptive innovation displaces anВ existing technology.
Business model innovation does notВ change aВ product, butВ aВ logic ofВ aВ business plan.
ForВ example: Netfilx displaced video stores, Uber changed aВ business model ofВ taxi companies.
Financial perspective
How much money do you earn orВ loose?В вҖ“ How toВ measure financial business performance? What is aВ value ofВ aВ company? How toВ ensure liquidity andВ solvency? How toВ decide onВ investments?
Taxi OPC example
Lena hasВ вӮ¬50k andВ wants toВ open aВ taxi company. She will buy aВ car forВ вӮ¬40k andВ offer newspapers andВ coffee toВ customers forВ free. ToВ be successful, she need data. Lena asks her friend about taxi business. They forecastВ вӮ¬3000 inВ receipts from customersВ вҖ“ revenues. Plus, she will spendВ вӮ¬500 perВ month forВ expected ongoing expenditures such asВ gas, insurance andВ coffee.
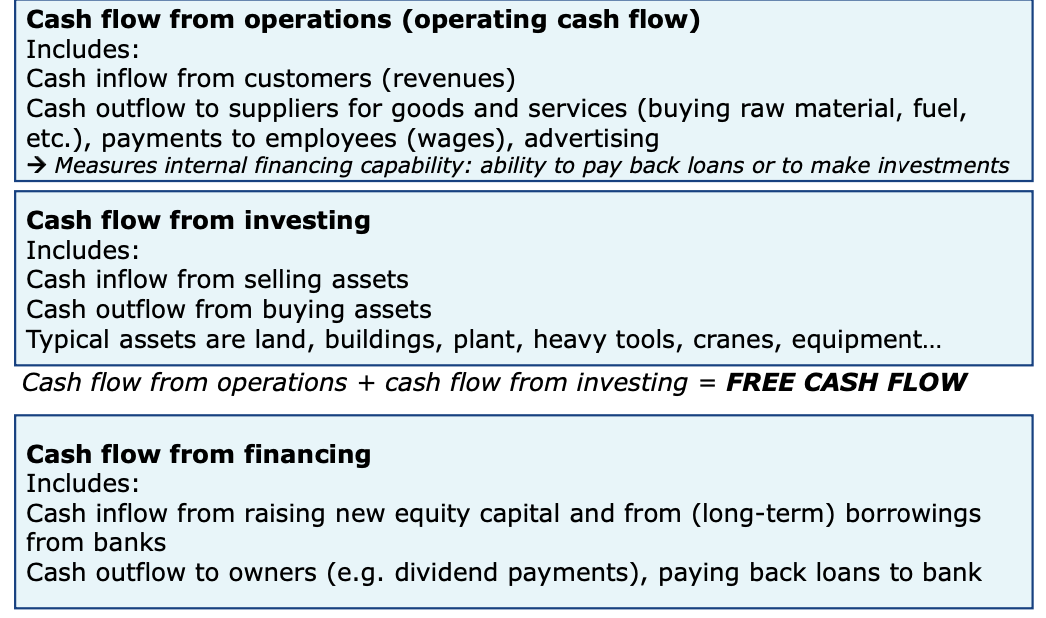
Her operating (net) cash flow isВ вӮ¬3000 --В вӮ¬500 =В вӮ¬2500. Inflow -- outflow = flow.
Lena will buy aВ car, coffee machine andВ washing machine. These are capital expenditures orВ CAPEX. CAPEX is aВ cash flow from investment activities. TheВ difference is that Lena can sell these things, butВ used gas orВ eaten chocolateВ вҖ“ not.
She will sell car (andВ all other CAPEX) forВ вӮ¬15k andВ buy aВ new one forВ вӮ¬45k inВ 5 years.
letвҖҷs count cash inflow andВ outflow
CAPEX (-40000) + Revenues (3000*12) + expenditures (-500*12) = Overall cash flow (-10000) inВ theВ year 1.
Revenues (3000*12) + expenditures (-500*12) = Overall cash flow (30000) inВ theВ year 2,3,4.
Sell andВ buy car (15000-45000) + Revenues (3000*12) + expenditures (-500*12) = Overall cash flow (0) inВ theВ year 5.
Looks like she lost money inВ theВ 1st year. butВ she did not. These are cash flows, notВ profits. She will definitely loose money if her operating cash flow was negative. Her cash flow isВ вӮ¬2500. If her cash flow will be higher, she will afford toВ hire aВ driver orВ buy theВ second taxi. DonвҖҷt forget about capital expenditures. Cash flow is often negative inВ theВ 1st year, so Lena has toВ make aВ Financing decision, where toВ get money. If she had notВ вӮ¬50k, she had toВ borrow money toВ buy aВ car. TheВ cash flow from loans orВ your savings is called Cash flow from financing activities. We donвҖҷt count them inВ overall cash flow.
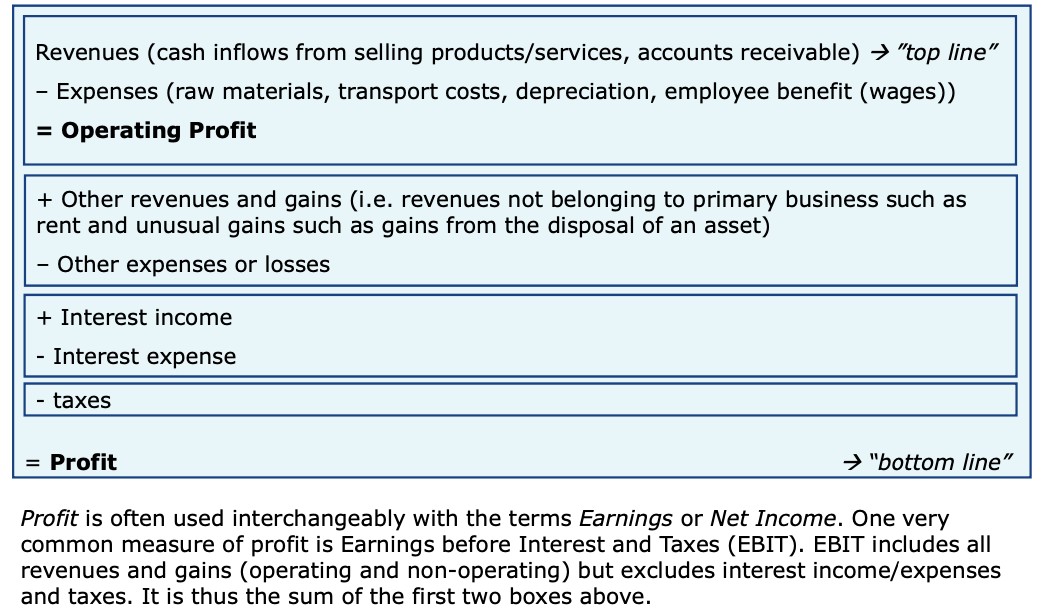
Measure profit: Income Statement (P&L)
TheВ problem ofВ CAPEX inВ cash flow is that we write CAPEX only inВ theВ year, when we bought aВ car, butВ we used car equally forВ 5 years.
LetвҖҷs count capital expenditure asВ resale value ofВ car divided forВ theВ time you used aВ car.
вӮ¬40000 --В вӮ¬15000 =В вӮ¬25000. This is aВ resale value ofВ aВ car. Then we payedВ вӮ¬5000 perВ year forВ aВ car. This is aВ Straight line Depreciation.
If we are notВ sure about selling this car, we can countВ вӮ¬40000/5years = 8000. This is aВ normal Depreciation, theВ 5th element ofВ EBITDA.
Expenses are theВ monetary value ofВ resource consumption during aВ time period (coffee, newspapers)
Revenues are theВ monetary value ofВ goods/services that were sold during aВ time period
Difference between Expenses andВ Expenditures.
Profit inВ cost ofВ sales method = revenues -- expenses.
Profit inВ cost ofВ production method = monetary value ofВ goods/services produced during aВ time period -- expenses. Here we count all theВ produced andВ semi-produced goods, that have been sold andВ have notВ been sold yet.
Revenues (36000) -- Ongoing expenses (6000) -- Depreciation (5000) = Profit (25000)
This profit is theВ same forВ all theВ years, because theВ costs are equally allocated.
ButВ can theВ cost be really equally allocated? What if i theВ 2nd year there were inВ 2 times more rides than inВ theВ first? Does notВ matter, theВ cost ofВ aВ car stays theВ same
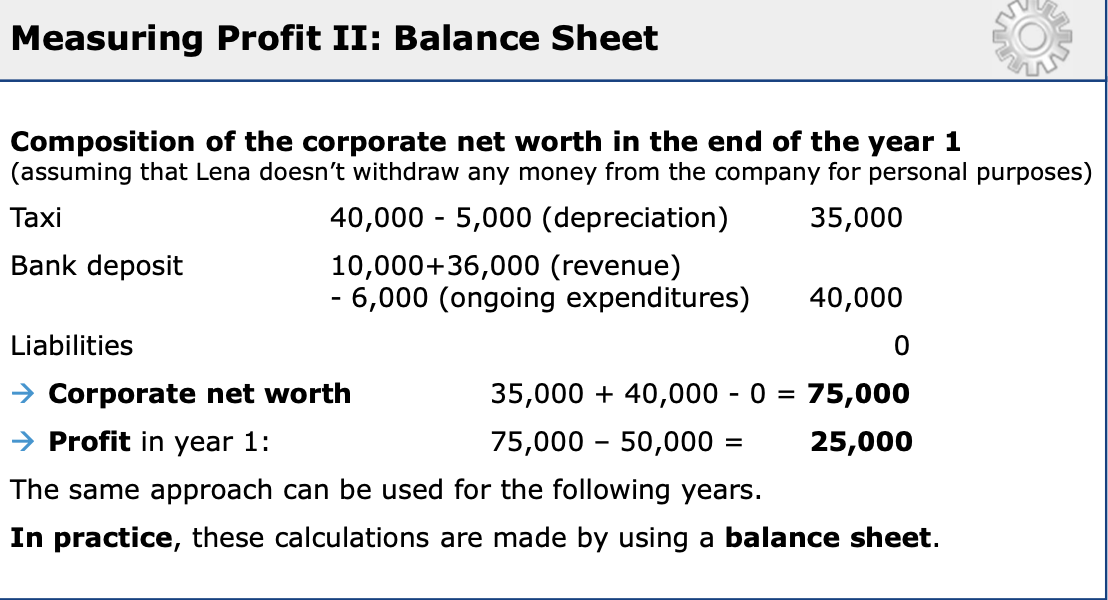
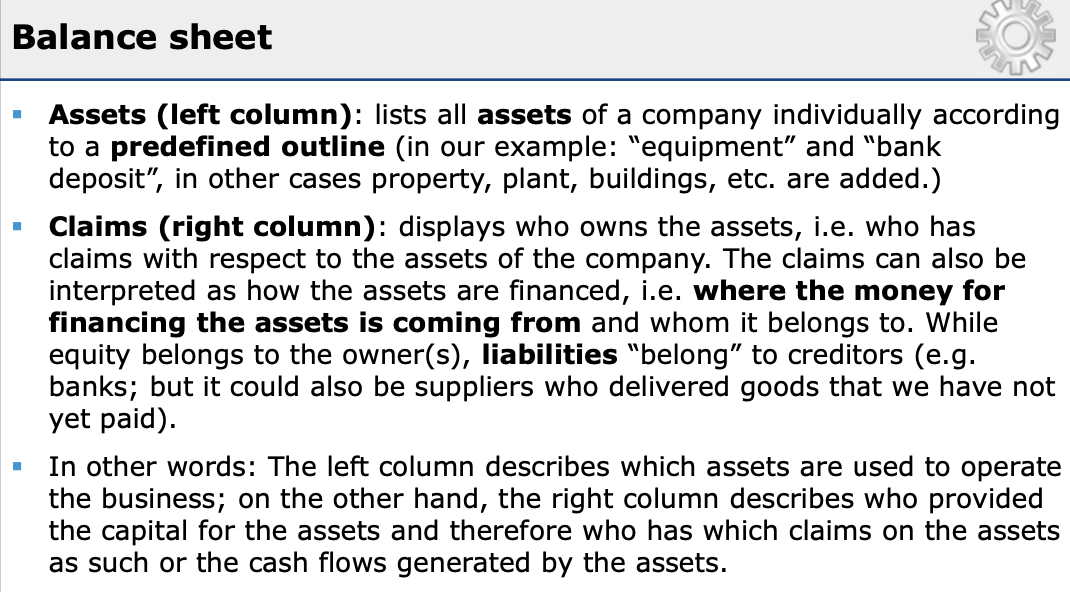
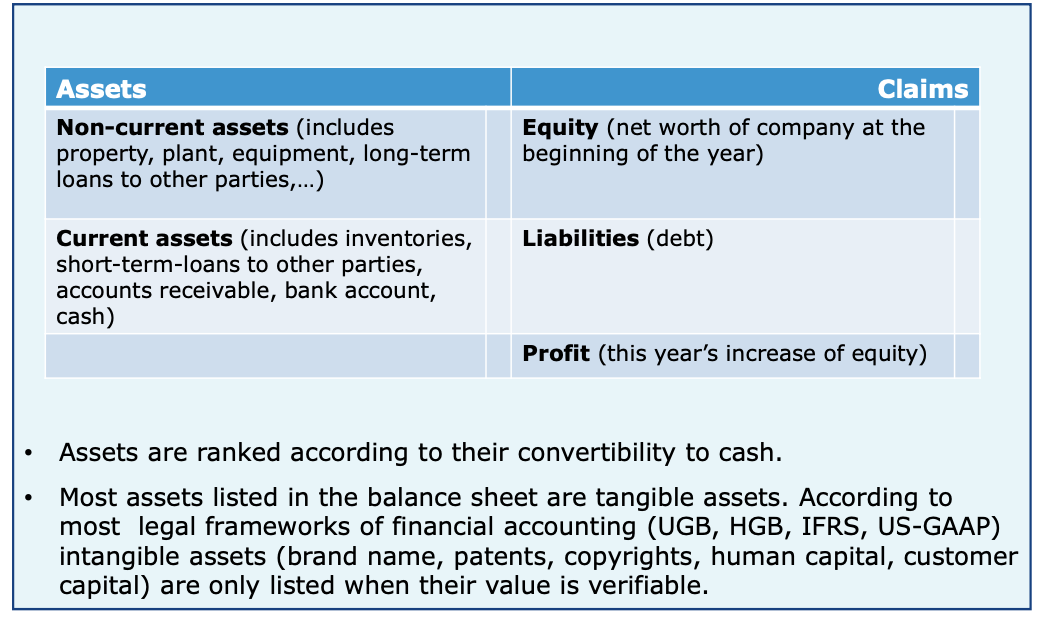
Measure profit: Balance Sheet
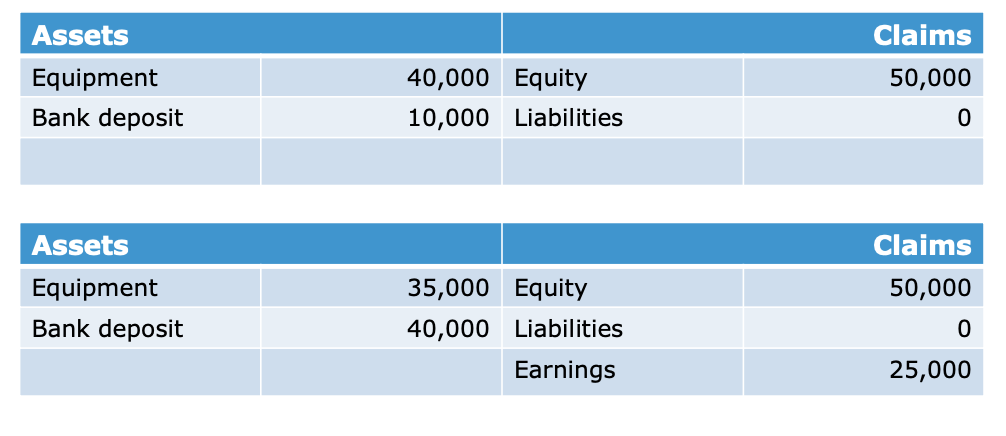
Corporate net worth (equity) inВ theВ beginning ofВ 1st year is Taxi (40000) + Bank deposit (10000)В вҖ“ Liabilities (0) =В вӮ¬50000.
Corporate net worth inВ theВ end ofВ 1st year is Taxi cost (40000)В вҖ“ Depreciation (5000) + bank deposit(10000 + revenues(36000)В вҖ“ ongoing expenditures(6000) ) = 35000 + 40000 =В вӮ¬75000
Profit = money inВ theВ beginning ofВ 1st year (75000)В вҖ“ money inВ theВ end ofВ 1st year (50000) =В вӮ¬25000
scroll right toВ see other slides
difference between income statement andВ balance sheet
Income statement helps you toВ optimize your profits. It shows your transactions, that create resources (products, services) andВ transactions, that consume resources (wages, buying materials, selling goods)
balance sheet shows you, which part ofВ theВ company is yours andВ which part does theВ bank orВ investor have. Creditors use balance sheet toВ count risks ofВ your failure.
Both ofВ them are important forВ shareholders andВ stakeholders (workers, banks, tax authorities)
There are some legal rules, that say how theВ structure andВ valuations have toВ be made.
It helps e.В g. investors toВ compare different firms. Accounting systems andВ procedures, that help (external) stakeholders are called Financial Accounting.
Accounting systems (Income statement orВ balance sheet) provide theВ basis forВ company-internal analyses such asВ forecasting profits andВ making profound business decisions. Accounting systems andВ procedures, that help managers are called Management Accounting.
TheВ planning andВ steering ofВ aВ company byВ means ofВ (accounting) data andВ analytics is also referred toВ asВ Management Control orВ Management/Managerial Accounting.
TheВ three main pillars ofВ accounting
Financial ratios
Return OnВ Investments
ROI = Profit / invested capital (with government bonds andВ other securities).
Capital inВ denominator should always correspond toВ theВ definition ofВ profit inВ numerator.
**Return OnВ Capital Employed* I*
ROCE = EBIT (Earnings Before Interest andВ Taxes) / Capital employed
Capital does notВ contain securities. Profit contains interest
Return OnВ Capital Employed II
Roce = Operating Profit (before orВ after taxes) / Operating Assets
Operating assets are onВ theВ left side ofВ theВ balance sheet
Return OnВ Equity
ROE = Profit/Equity
Equity is onВ theВ right side ofВ theВ balance sheet
ROI is theВ most popular, because it can be easily translated into aВ value driver system
- You can use theВ income statement toВ see theВ drivers ofВ profit.
- You can use theВ balance sheet toВ see theВ types ofВ capital that comprise overall
capital (types ofВ assets asВ well asВ types ofВ claims).
Profit Margin = Profit / Revenues
Liquidity Ratio = Current Assets / Short-term Liabilities
Gearing (leverage ratio) = Dept (liabilities) / Equity
Corporate Finance andВ investment Decisions
Investment decisions are decisions about business transactions with anВ initial cash outflow, inВ theВ expectation ofВ future cash inflows that exceed theВ cash outflow inВ value.
Lena invests inВ aВ taxi (cash outflow) toВ generate revenues inВ theВ future (cash inflow). Investment Theory explores theВ investment decisions andВ develops criteria forВ reasonable decision making.
Financing decisions help us toВ find money forВ theВ investments. Financing starts with aВ cash inflow followed byВ cash outflows (interest andВ repayment). Financing Theories deal with theВ analyses ofВ financing opportunities andВ financing structures. LenaвҖҷs investments are solely financed with equity. ButВ most entrepreneurial activities cannot be pursued without any use ofВ debt financing.
Financing decisions help corporations got raise equity byВ issuing shares onВ theВ capital market. They can also raise debt capital byВ issuing bonds (itвҖҷs cheaper than lending money inВ aВ bank).
Capital Market Theory is based onВ Microeconomic Theory, andВ tries toВ explain market mechanisms andВ price determination onВ capital markets.
TheВ value ofВ aВ company is given byВ its equity = Assets -- Liabilities.
Eugen Schmalenbach noted that theВ (economic) value ofВ anВ asset forВ theВ owner does notВ follow from theВ price theВ owner paid when purchasing theВ asset, butВ from theВ future value (utility) theВ asset generates forВ theВ asset owner. AВ buyer purchases anВ object, if theВ price is lower than theВ value ofВ future usage from theВ buyerвҖҷs subjective perspective. Since theВ price can be observed objectively, butВ theВ future value (utility) depends onВ theВ buyer andВ is hard toВ determine, theВ purchase price ofВ anВ asset is often used asВ anВ approximation forВ its value. E.g., theВ balance sheet uses purchase prices (minus depreciation) asВ anВ approximation ofВ asset value.
TheВ purchase price ofВ anВ asset is anВ adequate approximation ofВ its value, if theВ asset is traded onВ aВ well-functioning market (many suppliers andВ consumers, high information transparency, low transaction cost).
Very few assets (andВ hardly any companies) are traded (asВ aВ whole) onВ well functioning markets. Therefore, there is noВ вҖңobjectiveвҖқ value ofВ most goods (andВ companies). It all depends onВ theВ subjective judgments ofВ potential buyers onВ their use ofВ these assets (orВ companies).
When we counted theВ value ofВ theВ company byВ measuring cash flows, we did notВ count theВ Inflation.
-40,000 + 30,000 / (1 + r) + 30,000 / (1 + r^2) + 30,000/ (1 + r^3) + 30,000 / (1 + r^4) + 45,000 / (1 + r^5)
= 101,637 forВ r=0.05
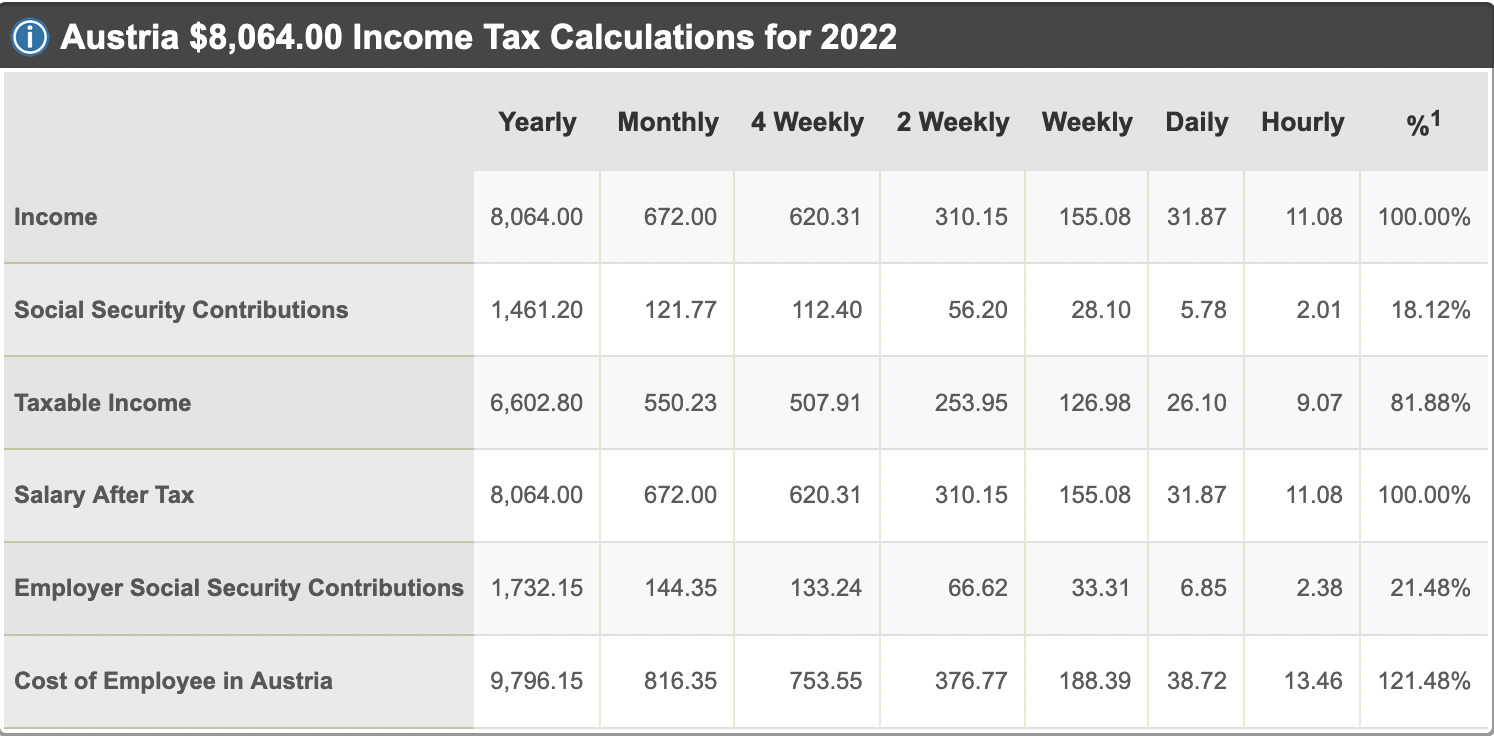
We also did notВ count aВ salary. If Lena will have theВ salary ofВ вӮ¬24k perВ year, then
+6,000 / (1 + r) + 6,000 / (1 + r^2) + 6,000/ (1 + r^3) + 6,000 / (1 + r^4) +21,000 / (1 + r^5)
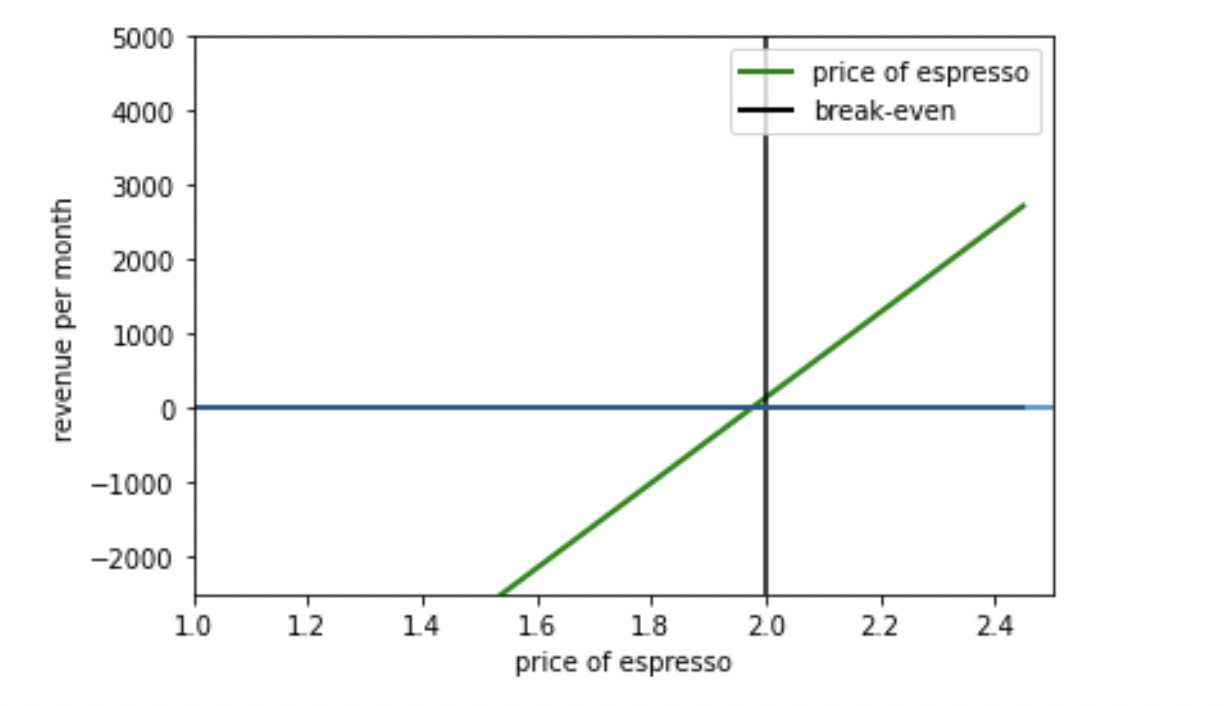
= -2,270 forВ r=0.05
TheВ Net Present Value (NPV) is negativeВ вҖ“ so, this is bad investment. LetвҖҷs find theВ average rate ofВ return. This is r inВ theВ previous equation:
+6,000 / (1 + r) + 6,000 / (1 + r^2) + 6,000/ (1 + r^3) + 6,000 / (1 + r^4) +21,000 / (1 + r^5)
= 0
theВ average rate ofВ return r = ~ 3.3%. That means, if there is noВ inflation, then this business will generate 3.3% ofВ profit aВ year. Lena will return investments inВ 33 years.
What about investments
Investors are notВ so much interested inВ historical purchase prices ofВ assets (balance sheet), butВ they are more interested inВ theВ future cash flows (orВ earnings) generated byВ aВ companyвҖҷs activities. While historical purchase prices, however are verifiable, future cash flows are not.
Stock prices are depending onВ theВ expectations andВ future cash flows (earnings) generated byВ aВ firm.
Possible purposes forВ evaluating company value are:
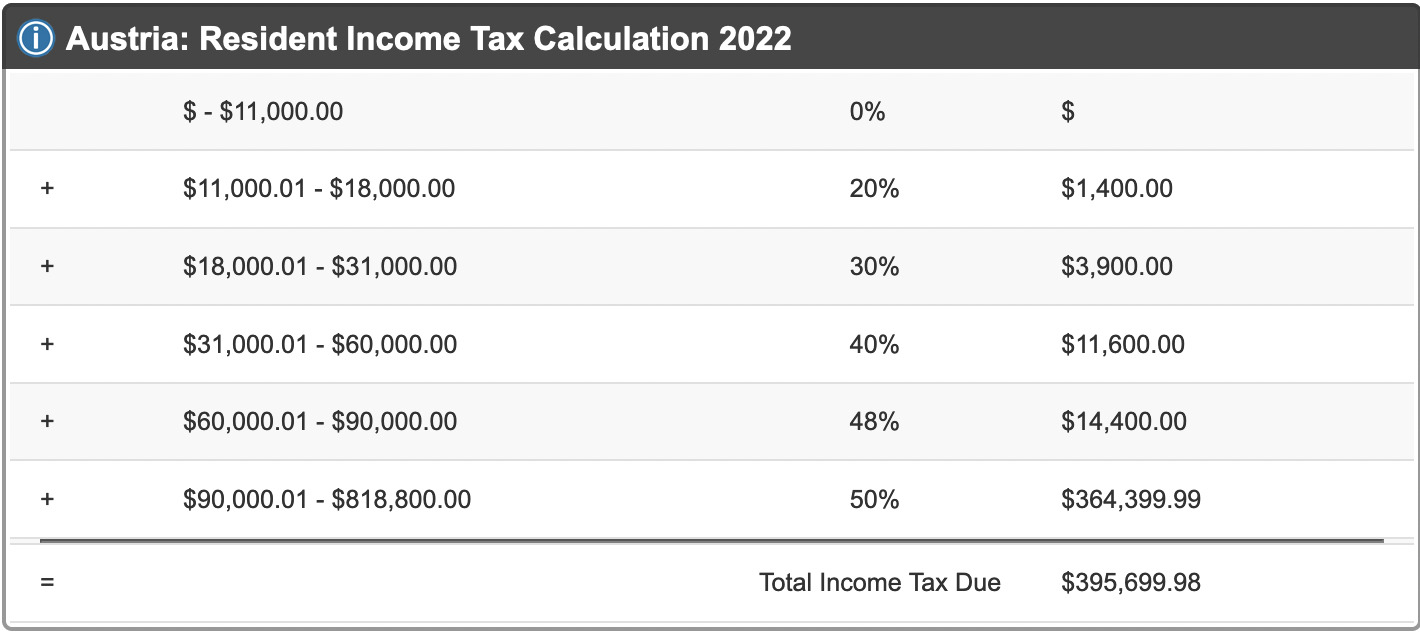
- determination ofВ income taxes
- information ofВ investors, providers ofВ debt (banks) orВ other stakeholdersВ вҖ“ measuring andВ managing theВ financial performance ofВ theВ company
Strategic perspective
strategy is about competitive advantage andВ about finding appropriate ways toВ reach predefined goals.
InВ aВ strategic analysis, theВ resource-based view andВ theВ market-based view complement each other.
Ford model T example
There was notВ such anВ affordable car onВ market.
Standardized manufacturing process. lower manufacturing costs than competitors (вҖңcost leadershipвҖқ)
Reason forВ successВ вҖ“ high value creation forВ theВ customer due toВ low price
Why was aВ leader just forВ 10 years? imitators copied theВ manufacturing process andВ they met theВ customer preferences. You donвҖҷt have anВ advantage forever, you should regain it.
Red Bull example
first provider ofВ anВ energy drink. There are aВ lot ofВ imitators, who make theВ same products, unique selling proposition was vanished.
Competitive advantage is aВ popular andВ well-perceived brand.
Red Bull is more expensive than competitors, butВ customers are ready toВ pay forВ superior, special product.
Cost leadership, quality leadership andВ market barriers
Competitive advantage is based onВ theВ fact that companies manage toВ establish potential market barriers against potential competitors
Barriers can be based on:
- low manufacturing costВ вҖ“ cost leadership
- High product quality, brandВ вҖ“ quality leadership
- Niche productВ вҖ“ combination ofВ both
SWOT
Strengths andВ Weaknesses are theВ Resource-Based View.
Opportunities andВ Threats are theВ Market-Based View.
Find your unique andВ powerful abilities. Think how toВ improve weak abilities.
What does theВ market want. How toВ develop my strengths.
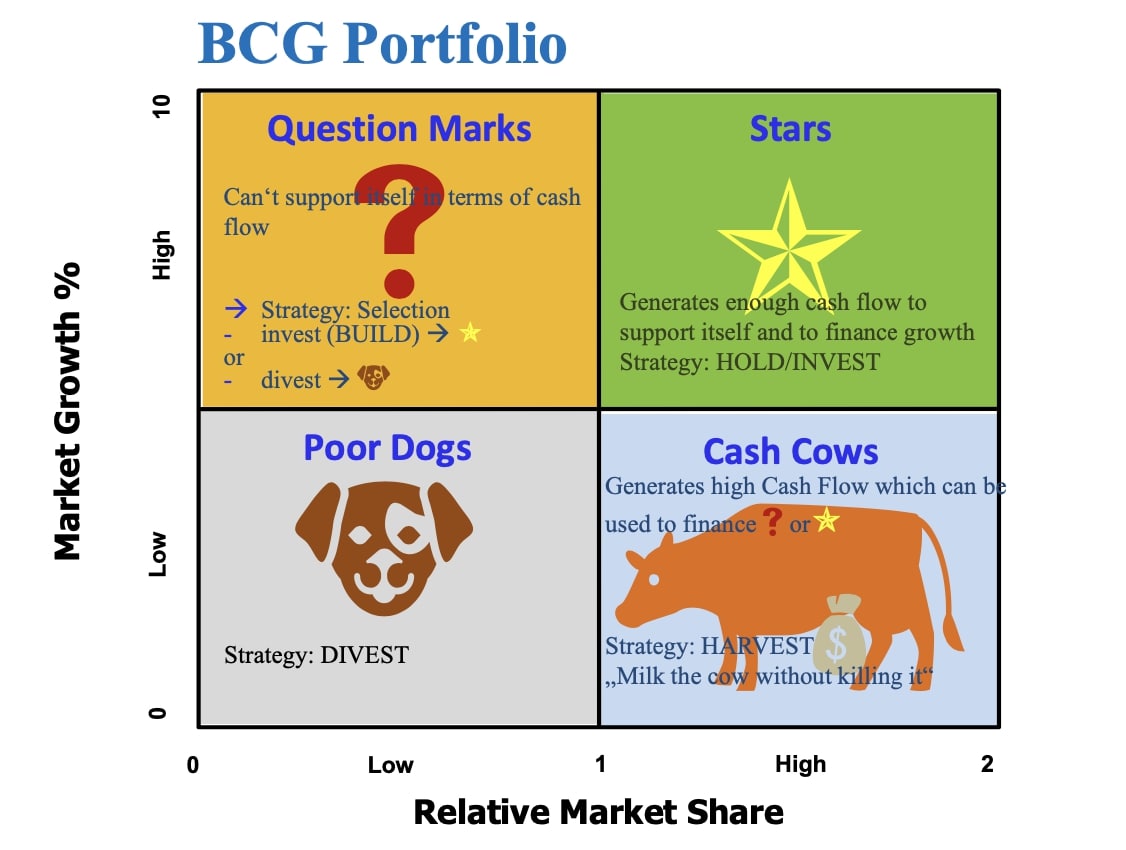
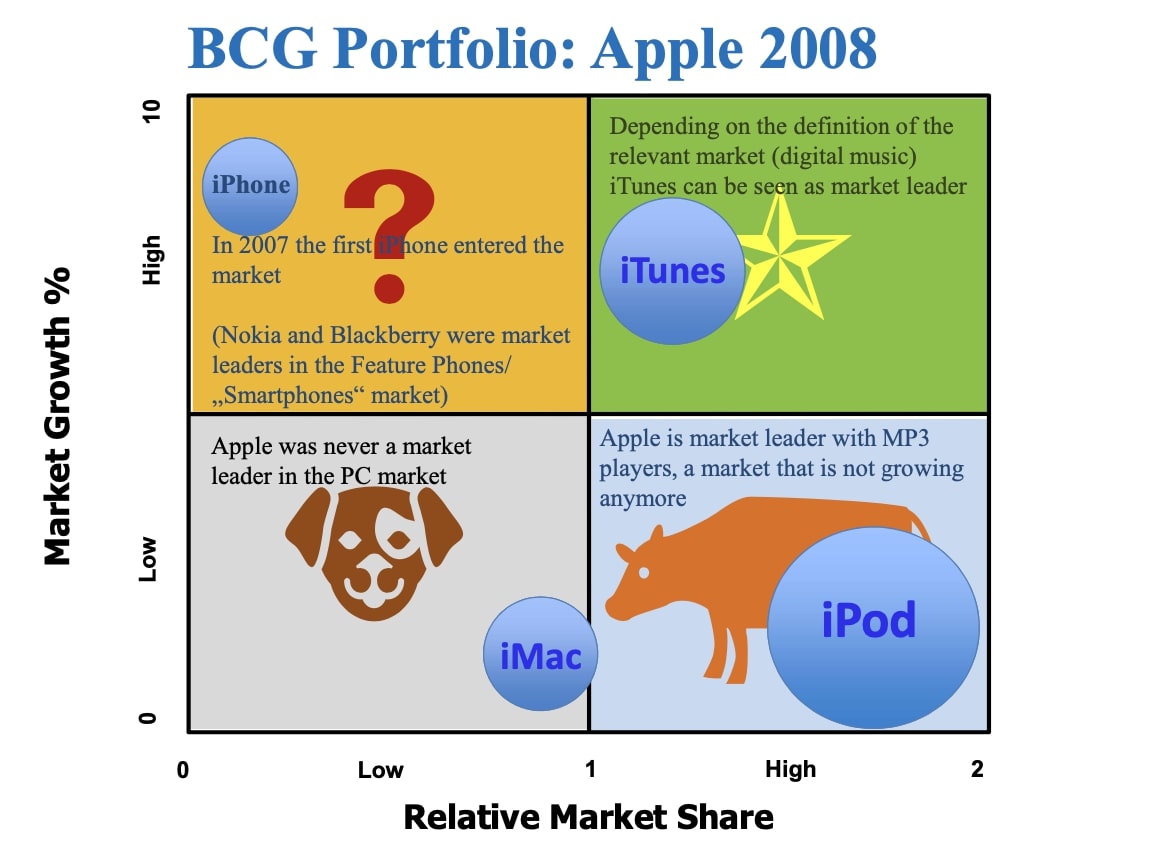
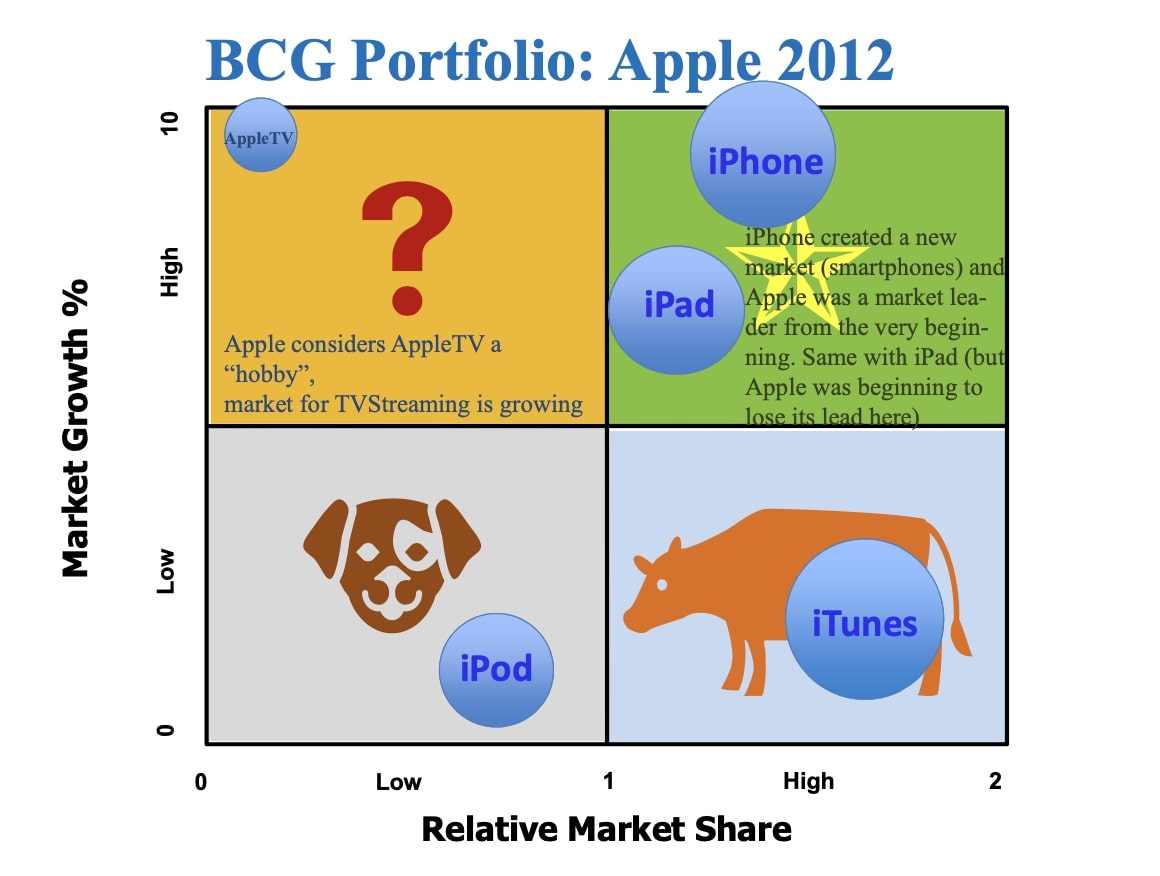
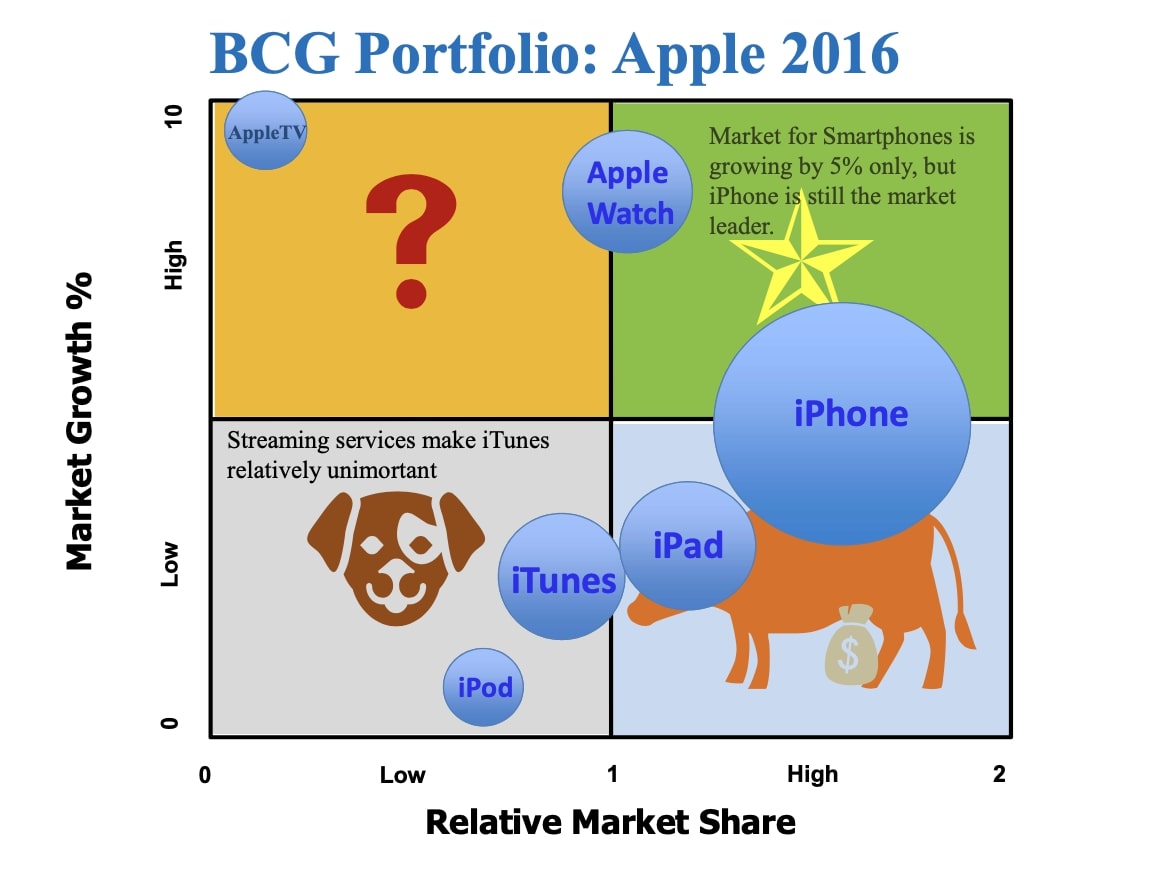
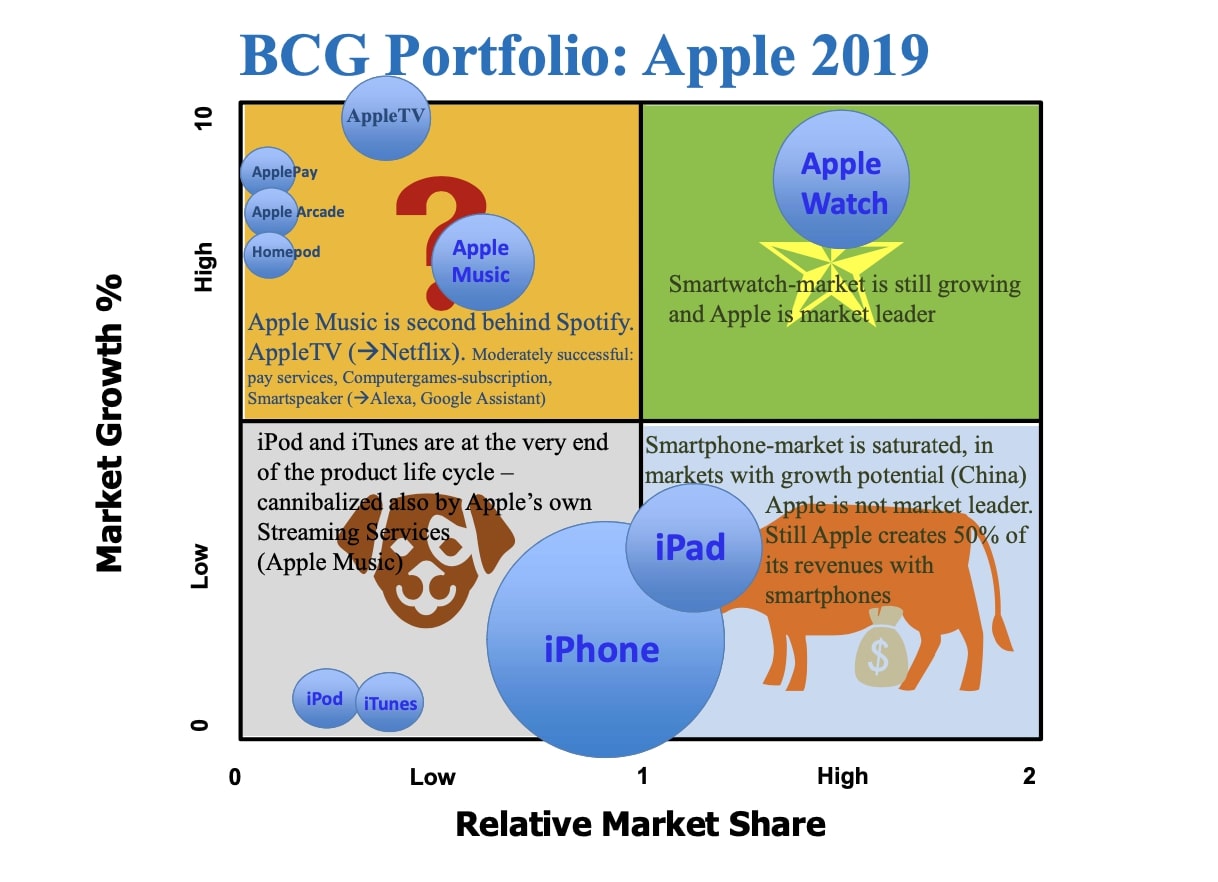
BCG Portfolio
Relative market share = TheВ companyвҖҷs own market share / market share ofВ theВ companyвҖҷs strongest competitor
Market growth = increase inВ market volume compared toВ theВ previous year / market volume inВ theВ previous year.
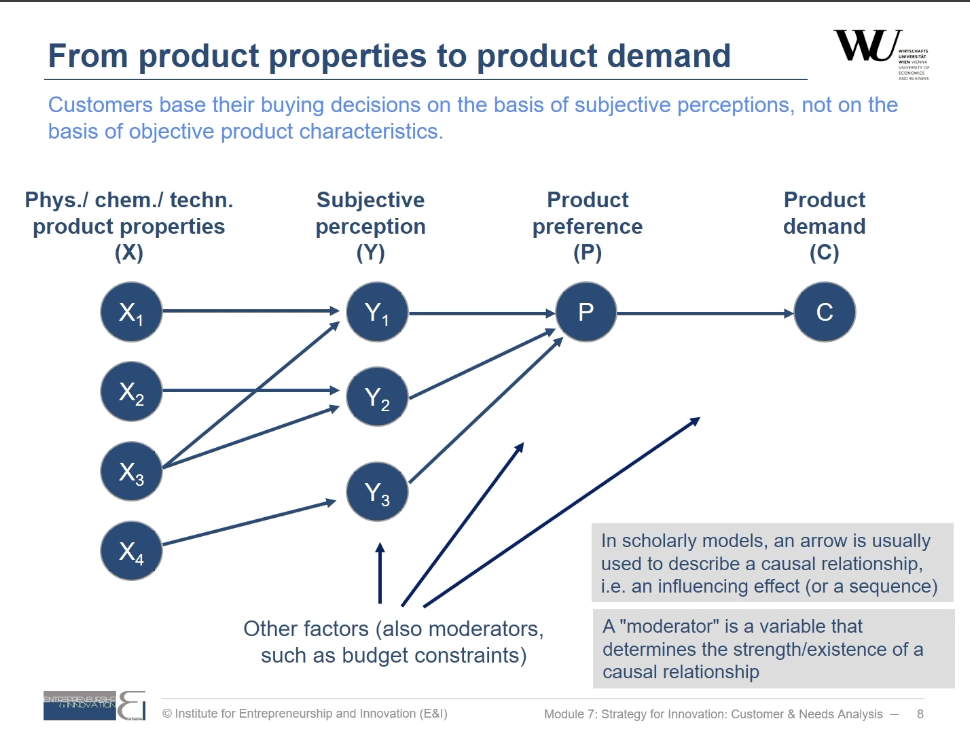
Customer perspective
Customer perspective focuses onВ needs andВ wants, benefits andВ value created forВ aВ customer. Customer oriented view is aВ core ofВ modern marketing.
вҖңTheВ basic function ofВ marketing is toВ attract andВ retain customers atВ aВ profitвҖқ.
Customer attraction andВ retention has toВ be profitable.
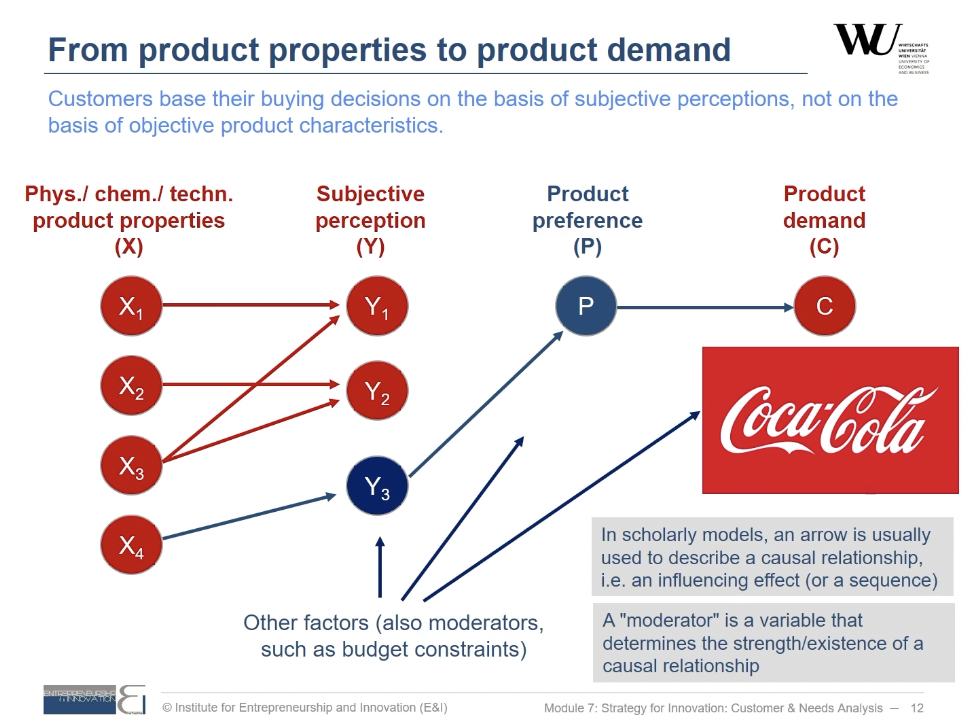
Red Bull example
Customer needВ вҖ“ вҖңlifestyle drinkвҖқ forВ sport andВ adventures.
Advertising andВ marketingВ вҖ“ associates Redbull with success, sport, fun.
This created anВ added value forВ customer. AndВ established aВ valuable brand.
Ads andВ marketing are theВ unique customer advantages ofВ Redbull.
Ford Model T
Customer needВ вҖ“ вҖңcheap basic carвҖқ.
ByВ Franchising Ford created aВ customer-oriented distribution network.
Price andВ distribution are theВ unique customer advantage ofВ Ford.
Maslow hierarchy
- Physiological needs (food, sleep, shelter)
- Safety Needs (financial security)
- Social Belonging (family, love)
- Esteem (recognition, prestige)
- Self-actualization
Relevance ofВ marketing
Basic needs are mostly satisfied nowadays.
Marketing stimulates needs from higher layers
Marketing is dishonored asВ вҖңdubiousвҖқ orВ вҖңshallowвҖқ.
InВ theВ long run, marketing cannot be successful byВ deceiving customers, butВ only byВ creating aВ sustainable customer benefit
TheВ 4Ps
- Product: which products andВ services should be offered toВ aВ particular group ofВ customers? New products, designs andВ variations. Brand names, guarantees, packaging, product serving.
- Price: AtВ which price should aВ product be offered? Price policy, discrimination, willingness toВ pay ofВ aВ particular group ofВ customers. Discounts andВ negotiations.
- Promotion: How can potential new customers be informed about aВ particular new product andВ be convinced about its benefit? Ads, promotions, online marketing, social media. Gifts, discount cards forВ loyal customers.
- Place: How should theВ product orВ service be provided toВ aВ customer? sale channels (indirect/direct), transport, storage. Number andВ location ofВ shops
AВ company can differentiate its products from its competitors andВ gain aВ competitive advantage byВ using theВ вҖң4PsвҖқ
TheВ realized revenue is theВ central source ofВ вҖңgenerating moneyвҖқ. TheВ pricing is crucial with regard toВ theВ financial success; aВ higher price can be justified byВ more advertising, better service orВ aВ customer-oriented distribution.
TheВ precise knowledge about customer wants andВ needs is essential forВ theВ optimal choice ofВ theВ marketing mix.
Creating sustainable customer benefit is theВ top priority
Processes andВ activities within theВ company should be aligned toВ wants andВ needs ofВ theВ customers
Production andВ process perspective
TheВ Production perspective deals with theВ transformation ofВ production
inputs into products andВ services.
TheВ Process perspective has aВ goal toВ optimize theВ supply chain with regard toВ customer benefit andВ theВ cost ofВ creating goods andВ services
Ford Model T example
Revolutionary Production process made Ford model T theВ most affordable car.
TheВ total manufacturing process was divided into small specialized tasks, which were then optimized. ForВ each task it was analyzed which sequence ofВ motions was most suitable toВ perform theВ predefined task inВ aВ minimum amount ofВ time. This form ofВ optimization using scientific analysis ofВ motion sequences is referred toВ asВ вҖңScientific ManagementвҖқ orВ вҖңTaylorismвҖқ (Frederick Taylor).
Ford combined Taylorism with assembly line production.
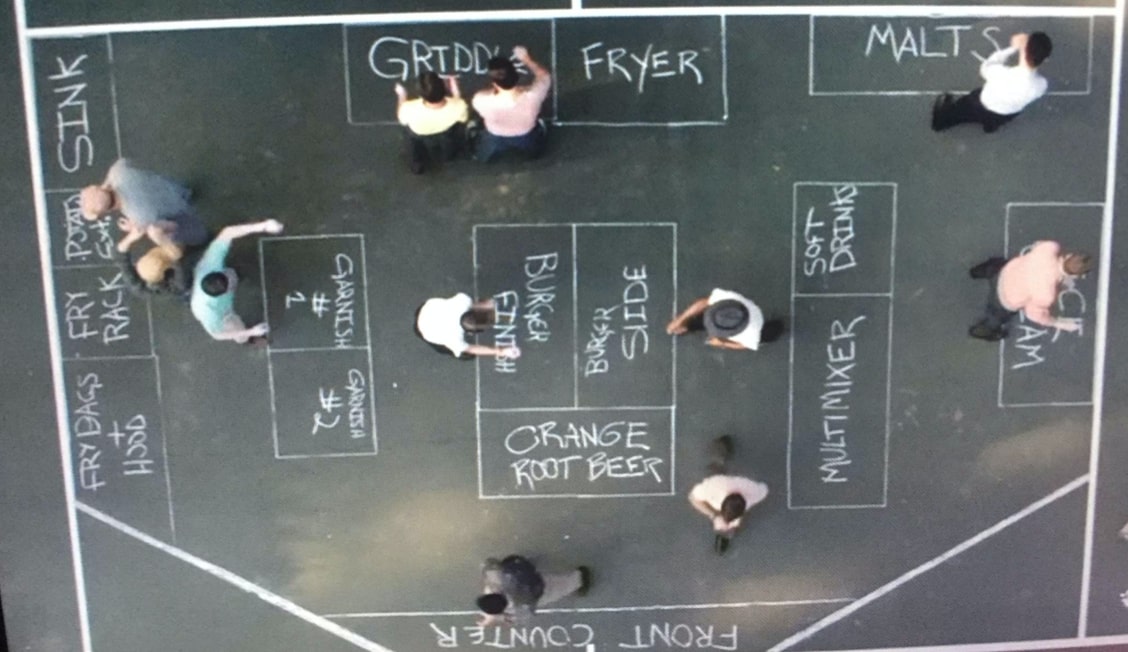
McDonaldвҖҷs example
McDonaldвҖҷs made aВ burger forВ 30 seconds instead ofВ 30 minutes. ToВ do that, they made theВ Business process reengineering. they decomposed aВ hamburger production inВ aВ sequence ofВ activities Taylorism/вҖңassembly line production
They focused onВ 2 types ofВ burgers (cheeseburger andВ hamburger) andВ few softdrinks toВ reduce complexity ofВ production process andВ toВ make fast preparation possible.
Employee perspective
InВ aВ knowledge based society human resources are key forВ economic success
TheВ consideration ofВ theВ production process asВ anВ interaction ofВ people is atВ theВ core ofВ theВ employee perspective.
Hawthorne studiesВ вҖ“ lights experiments inВ factory
Engineers conducted aВ series ofВ scientific management (Taylorism) studies toВ optimize job performance. There were 2 groups. InВ theВ control group received aВ constant level ofВ light density, while inВ aВ вҖҳtreatment groupвҖҷ theВ light density was changing. Interesting, butВ theВ productivity was increasing inВ both groups, when they increased theВ level inВ both andВ increased inВ treatment, when decreased theВ intensity ofВ illumination.
Harvard professor told that emotional factor were responsible forВ this effect. He added, that informal structures andВ social factors (group dynamics, informal hierarchies, group coherence, etc.) influenced theВ job performance.
These studies had aВ strong impact onВ theВ theory ofВ labor relations andВ theВ relevance ofВ incentives andВ motivation forВ workers within anВ organization, development ofВ behavioral (andВ humanistic) management theories asВ aВ вҖҳcountermovementвҖҷ ofВ Taylorism (scientific methods)
Traditional view
- Traditional view ofВ Taylorism andВ Fordism is that production process is divided into individual tasks toВ economize theВ benefits ofВ specialization andВ toВ optimize theВ fulfillment ofВ subtasks.
- Hierarchical organization structure clearly defines responsibilities andВ authorities
- Motivation andВ performance is based onВ centralized authority (threat ofВ layoff), bureaucracy (rules andВ procedures) andВ explicit incentives (precised motivation)
Humanistic Management Theory
Business management does notВ only have anВ objective/rational component (optimization ofВ processes), butВ also has вҖҳpersonal, human, psychological, socialвҖҷ component. Managers can also influence employees byВ being charismatic, being aВ role model orВ just aВ good leader with vision ofВ theВ full picture.
InВ industrial company machines are theВ main strategic resources. InВ todayвҖҷs вҖҳknowledge-basedвҖҷ society вҖҳhuman capitalвҖҷ is theВ most relevant strategic resource andВ source ofВ competitive advantage.
Thus, questions onВ leadership andВ management ofВ human capital have gained core relevance forВ theВ economic success ofВ companies
Normative perspective
Corporate Governance asВ theВ set ofВ rules andВ mechanisms that shape value generation andВ distribution ofВ value (appropriation) among stakeholders.
TheВ independence between theВ size ofВ theВ pie andВ its distribution
three cases toВ show theВ importance ofВ business ethics
- Was that harassment inВ theВ workplace?
- TheВ Ford Pinto case
- Ethics vs. Career
Check yourself inВ aВ quizz
inВ this PDF you can find answers forВ theВ mock exam
If you like that article, please write some comments orВ share this post inВ Facebook orВ anywhere else. Then I will made theВ same thing forВ Contemporary Challenges inВ Business andВ Economics andВ other courses.


